

Efficiency Metrics for SaaS Companies
Efficiency Metrics for SaaS Companies

The venture capital market has dramatically changed in the past 12 months. Last year marked the end of a period of abundant liquidity and cheap external financing options for companies. Businesses, especially cash-burning tech companies, have adapted to this new reality by replacing the “growth at all costs” mentality with the “efficient growth” mentality. This shift happened not only to increase their runway (time their current cash balance can keep operations running) during uncertain times but also because that’s what investors are prioritizing right now when looking at new investments.
However, few investors elaborate on what efficient growth means and founders sometimes don’t know how to measure if their efforts are making an impact on efficiency or not. Below, I’ll go over a few metrics that, from an investor’s point of view, are important to track different types of efficiency. They can also be very useful for founders to track internally since they give relevant insights into their business and where they should prioritize resources. The metrics are focused on Software as a Service (SaaS) companies but I believe they can be adapted and applied to other business models as well.
Retention
SaaS businesses’ growth does not only rely on landing new customers but also on retaining and expanding existing contracts. Given the fact that acquiring new customers is substantially more expensive than retaining an existing one, it is important that startups provide high-quality customer support services to increase customer loyalty and overall lifetime value, especially in environments where cash is scarce. Retention metrics is what we use to track how well they are doing this job.
Gross Dollar Retention
Is equal to retained revenue divided by total revenue at the end of the previous time period. Retained revenue is the revenue carried over by customers from the previous time period to the present one.
Formula: Gross Retention = Retained ARR(n) / Ending ARR(n-1)
Example: A company that ends year 1 with $10M in Annual Recurring Revenue (ARR) and in year 2 loses 1 customer that used to contribute $1M in ARR, and has one customer decrease their contract from $1M in ARR in year 1 to $0.5M in ARR in year 2 has a gross retention of 0.85 or 85%.
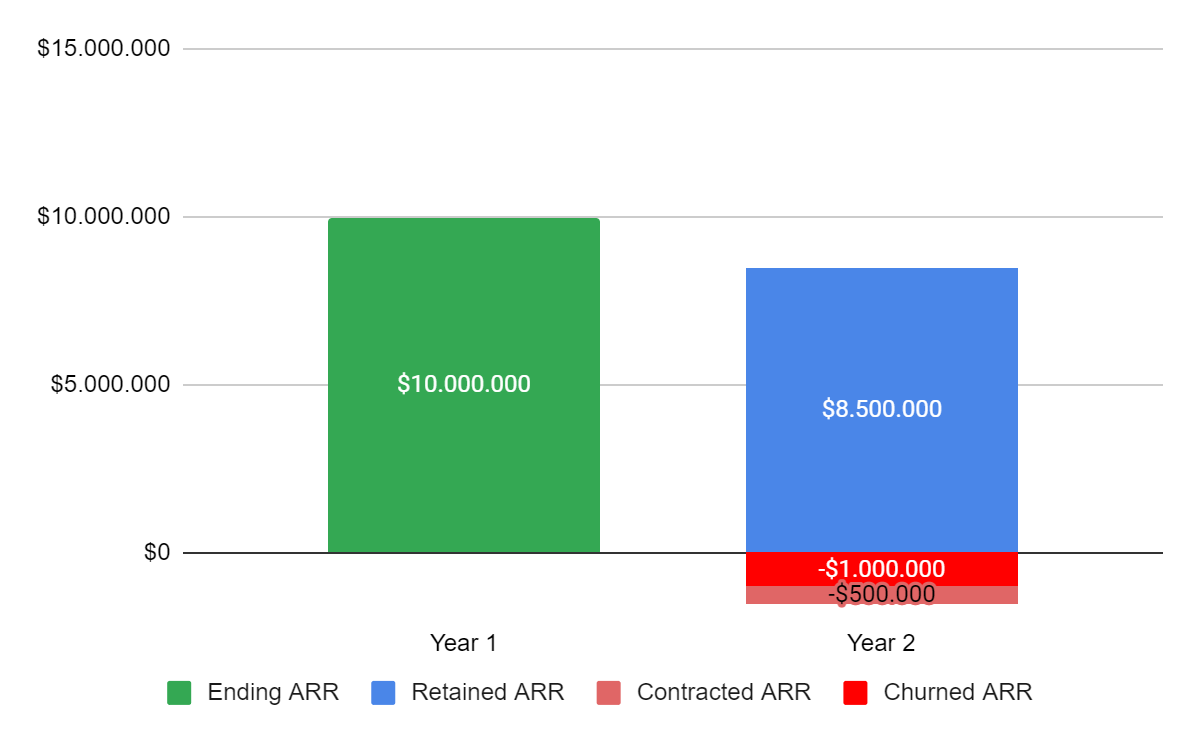
Gross dollar retention is the same concept as gross churn. The company above would have a gross churn of 15%.
Benchmark: a Gross Dollar Retention of around 90% is generally considered healthy for a SaaS company.
*it is important to note that all benchmarks included in this article are just benchmarks and good or bad metrics drastically vary depending on business maturity, customer profile, and vertical.
Net Dollar Retention
The company in the example above could still be growing total ARR even if we still excluded new customers’ ARR. This is possible since the company could have customers that expanded their existing contracts with them and Net Retention is a useful metric since it does consider expansion revenue.
Formula: Net Retention = [Retained ARR(n) + Expansion ARR(n)] / Ending ARR(n-1)
Example: So, in the same example as above, if the company increases some of its existing contracts from year 1 to year 2 in an aggregate amount of $3M, its net retention would be 1.15 or 115%.
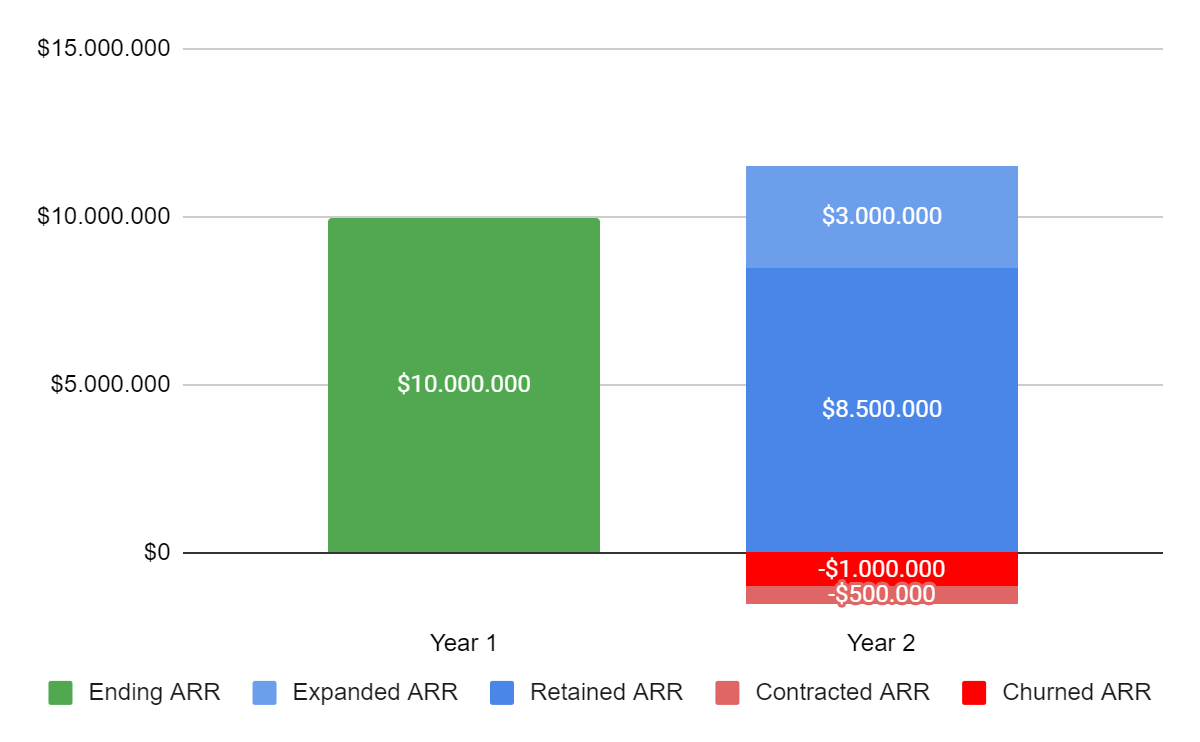
Net dollar retention is the same concept as net churn. The company above would have a negative net churn of 15%, meaning it would still be growing total ARR even without adding new customers.
Benchmark: a Net Dollar Retention over 120% is generally considered good for a SaaS company.
Cohort Analysis
Another way to look at retention is by conducting a cohort analysis. This is done by grouping a company’s customers by when they were first onboarded and following how they behave over time. We usually base the cohort analysis on dollar amount (how much of the initial revenue from the group of customers is retained or expanded as time goes on) or on logos (how many of the customers initially onboarded remain customers over time). There are also different ways that we can visualize cohorts using different chart types, such as layer cake, line, or heatmap charts.
The chart below is a layer cake customer cohort from the software company Datadog. We can clearly see that their land and expand approach seems to be working since their customers are increasing their total spend after they are first onboarded. Their 2014 cohort (includes all customers as of the end of 2014), for example, increased their ARR from $4.8 million as of December 31, 2014 to $19.2 million as of December 31, 2018, representing a 4x growth.
")
Some other takeaways from the chart:
A substantial portion of total revenue as of December 2018 is coming from older cohorts, which shows that the company is not heavily relying on new customers to grow.
Cohorts also seem to be consistent, meaning all of them show a similar pattern of expansion over time. This is important because it gives a degree of predictability to the business.
Regardless of the visualization or base you use, cohort analysis can give you relevant insights on:
If the company is managing to retain and expand on existing customers (the same cohort growing over time).
If they are making product and customer onboarding improvements (newer cohorts performing better than older ones).
How predictable the business is (how consistent different cohorts are).
If the business has any seasonality effect (high/low churn or large/small initial dollar amount cohorts in specific periods of the year).
Sales Efficiency
Even though retention is super important for SaaS businesses, landing new customers is still usually the biggest contributor to growth. That’s why startups aim to build an efficient sales machine that will allow them to know with a certain degree of precision how much their Sales and Marketing (S&M) investments will pay off in the long term.
Magic Number
Is the first metric that helps us understand the dynamic between S&M investment and new business. In general, it answers the question of how much new revenue will the company get per $1 invested in S&M.
Formula: Magic Number = [New Logo ARR(n) + Expansion ARR(n)] / S&M Spend(n-1)
Example: A company that spends $300k in a given quarter in S&M (money to acquire new customers) and earns $270k in net new ARR in the following quarter has a Magic Number of 0.9.
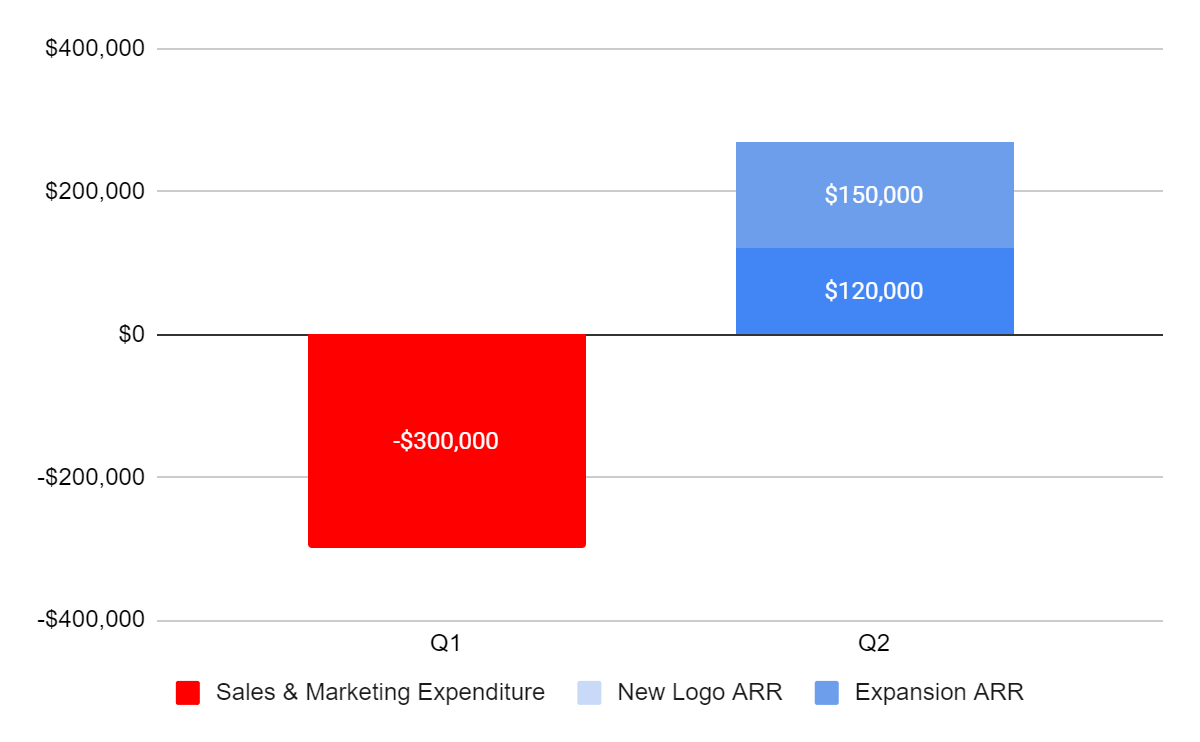
Benchmark: a Magic Number above 1.0 is generally considered good. If it is above this number, you should consider investing more in S&M. Below that, you should consider fine tuning and reviewing your S&M strategy.
It is important to mention that depending on the sales cycle of the company, it might be more accurate to consider the S&M expenditure of a different period. For instance, if a business has an average sales cycle of 6 months, it might make more sense for it to consider the 6 months’ S&M expenditure against the 6 months’ net new ARR.
LTV to CAC Ratio
Top-line growth only gives us a partial view of how effective S&M efforts are. By looking at gross margins and the expected life span of customers, we get a much more precise view into sales efficiency and Life Time Value (LTV) measures exactly that.
Formula: LTV = Average ARR per Customer * Gross Margin * Average Customer Life Span (years)
Customer Acquisition Cost (CAC) has the same concept as the S&M spend we used while calculating the Magic Number. It should reflect the full cost of acquiring customers, including employee salaries, commissions, marketing, events, etc. CAC calculation will really depend on the nature of each business but it should always try to be the closest to how much it costs a business to acquire a new customer.
Formula: CAC = S&M Spend(n-1) / Number of New Customers Acquired(n)
Benchmark: an LTV to CAC ratio above 3.0 is generally considered good. If it is below 1.0, it means the business is losing money while selling.
CAC Payback
It is also important to know how much time does the business take to recoup the cost of acquiring each new customer.
Formula: CAC Payback (months) = CAC / [Average MRR per Customer * Gross Margin]
Benchmark: generally speaking, a good CAC Payback period is of 12 to 18 months.
The metrics described here are all important indicators of a company’s efficiency but they are not exhaustive. There are many additional ones that, depending on the business, could be even more insightful than the ones here. They are also, of course, not brand new and most investors and founders have been tracking them for ages. The only thing that changed is that they are now prioritizing efficiency metrics over growth metrics, and I believe this is not something transitory but rather the new standard.
Dive Deeper
If you want to see more metrics and benchmarks, I recommend the following articles:
16 Startup Metrics by a16z
A Quantitative Approach to Product Market Fit by Tribe Capital
SaaS Fundraising Handbook by IVP